Methods
Mark Platts
2018-03-03
Last updated: 2018-11-16
Code version: ca9a713
Introduction
Project goal
The goal of this project was to extract the common behavioural patterns of bees in an experiment which shared similarities to the morris water maze experiment. Cluster analysis has previously been applied successfully to the morris water maze experiment to provide insight into how rodents behave at a fine grain resolution. The goal of this project was to investigate whether similar techniques were generalizable to different experiments and species. In this case we investigated the behaviour of bees in an experiment adapted from the detour paradigm, an experiment similar to the morris water maze experiment.
The Adapted Detour paradigm experiment
In this experiment, a bee was placed in a circular arena in which their ability to move was restricted to x and y directions only. The circular arena prevented them from moving vertically. Lights were then switched off and on at different positions along the edge of the arena. The bee’s position was tracked for the duration of the experiment, producing a dataset of x, y coordinates at uniform time intervals. The experiments were conducted for 3 different treatment groups (1) bees given no treatment (‘NT’) (2) bees treated with saline (3) bees treated with procaine.
Methods
Feature extraction
One of the central challenges of this project was to extract features from the bees recorded x,y coordinates, representing the data in a format that would enable typical behaviours to be detected using cluster analysis. Features were selected that were likely to capture the geometric and positional characteristics of a segment.
Features
Median distance from the centre
This is the median Euclidean distance of a segment’s points from the centre of the arena scaled by the arena radius (Tiago V. Gehring 2015).
Interquartile range of the distance from the centre
This is the difference between upper and lower quartile distances from the centre scaled by the arena radius (Tiago V. Gehring 2015).
Focus
The focus is specified as: \[f=1-\frac{4A}{\Pi d^2}\] Where A is minimum enclosing ellipsoid around the segment and d is the segment length (Tiago V. Gehring 2015).
Eccentricity
The eccentricity is specified as:
E=1-b2/a2 \[E=1-\frac{b^2}{a^2}\] Where a and b is semi-major axis and the semi-minor axis of the enclosing ellipse (Tiago V. Gehring 2015).
Inner radius variation
The inner radius variation is specified as: \[ v = \frac{(c_{UQ}-c_{LQ})}{c_{MED}} \] Where \(c_{UQ}\), \(c_{LQ}\) and \(c_{MED}\) are the upper quartile, lower quartile and median for the distance from the centre of the minimum enclosing ellipse (Tiago V. Gehring 2015).
Central displacement
The central displacement is specified as the distance between the centre of the arena and the centre of the minimum enclosing ellipse (Tiago V. Gehring 2015).
Path efficiency
The path efficiency is specified as: \[P=\frac{\sqrt{(x_n-x_1)^2+(y_n-y_1)^2}}{\sum^n_{i=1}\sqrt{(x_{i+1}-x_i)^2+(y_{i+1}-y_i)^2}}\] Where \(x_i\) and \(y_i\) are ith x and y coordinates of the segment respectively and n is the number of points in the segment. intuitively, it can be thought of as how directly the segment moves from one location to another (Illouz et al. 2016).
Sum of absolute angles
The sum of absolute angles is specified as: \[S=\sum\arccos\left(\frac{\langle{\bar{u}},\bar{v} \rangle}{||\bar{u}||.||\bar{v}||}\right)\] Where \(\bar{u}\) and \(\bar{v}\) are sequential vectors (Illouz et al. 2016).
Intermediate calculations
Calculating the position of the centre of the arena
The centre of the arena was taken to be the midpoint between the max and min x and y coordinates in the entire dataset of points.
Calculating the diameter of the arena
The diameter of the arena was taken to be either the distance between the max and min Y coordinate or the max and min X coordinate, whichever was the greatest.
Determining the minimum enclosing ellipse
The minimum enclosing ellipse was computed using the Khachiyan Algorithm. Code from https://ecogenomics.github.io/GroopM/dev_docs/groopm.ellipsoid.EllipsoidTool-class.html was used with some modifications to work for 2d data.
Segmenting the bee’s path
A bee’s path is defined as he entire path from beginning to end for a single instance of the experiment (Figure 1).
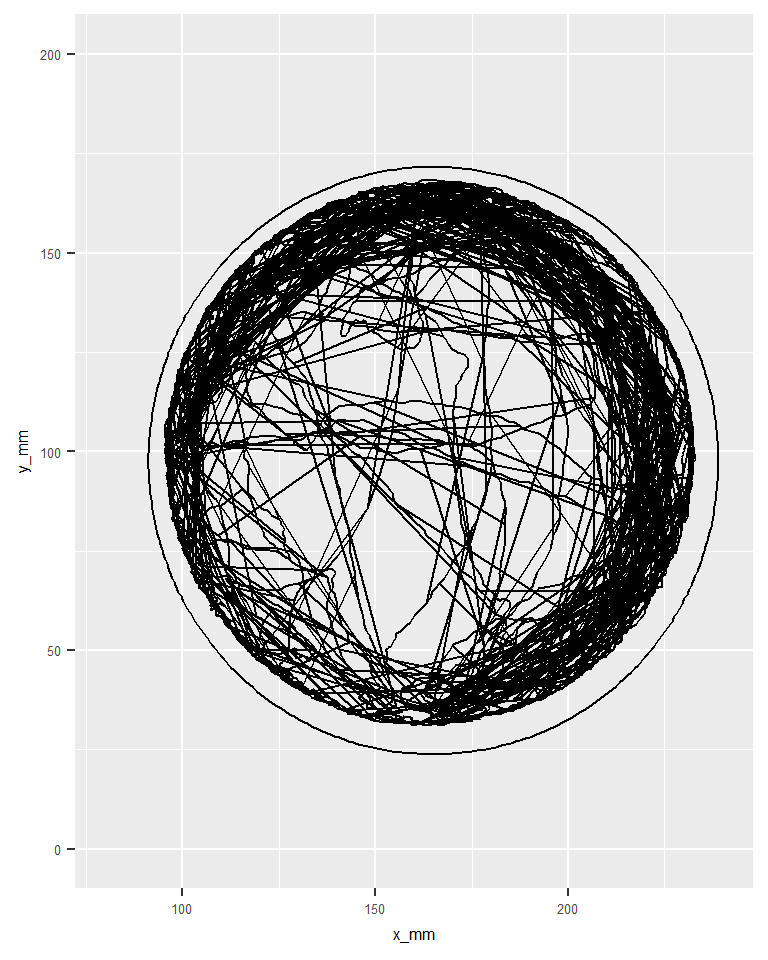 Figure 1: The full path of a bee in a single experiment.
This was split up into segments of a uniform length where each consecutive segment overlapped the previous segment by 70% of its length. Figure 2 shows 3 overlapping segments while Figure 3 shows them separately.
Warning: package 'bindrcpp' was built under R version 3.4.4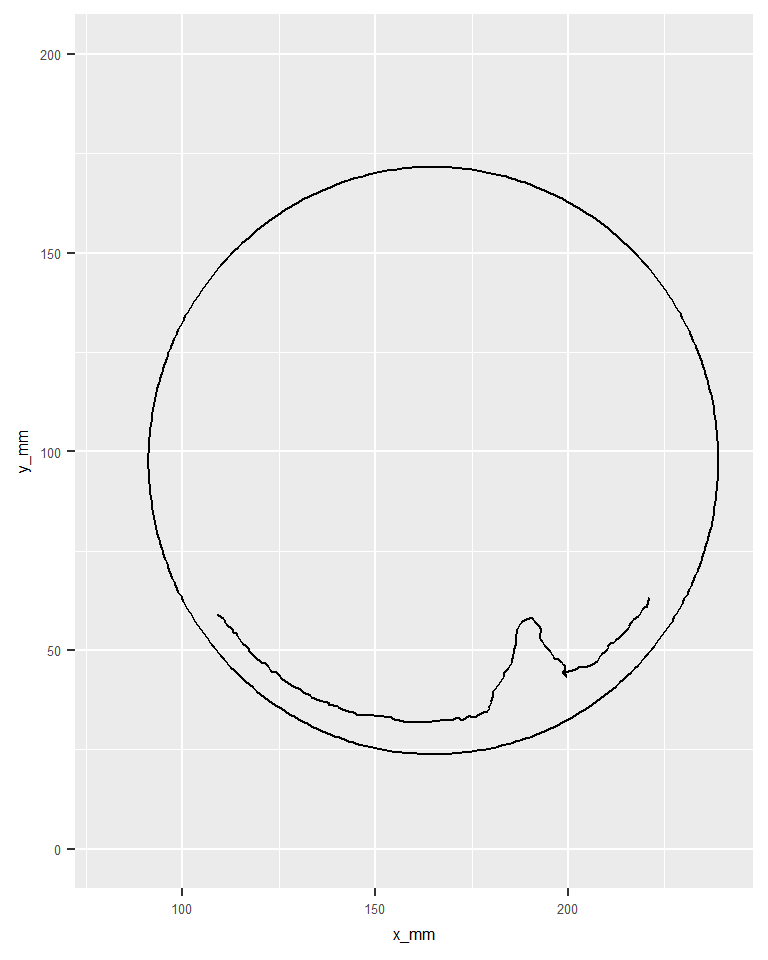 Figure 2: Three overlapping segments from the full bee’s path.
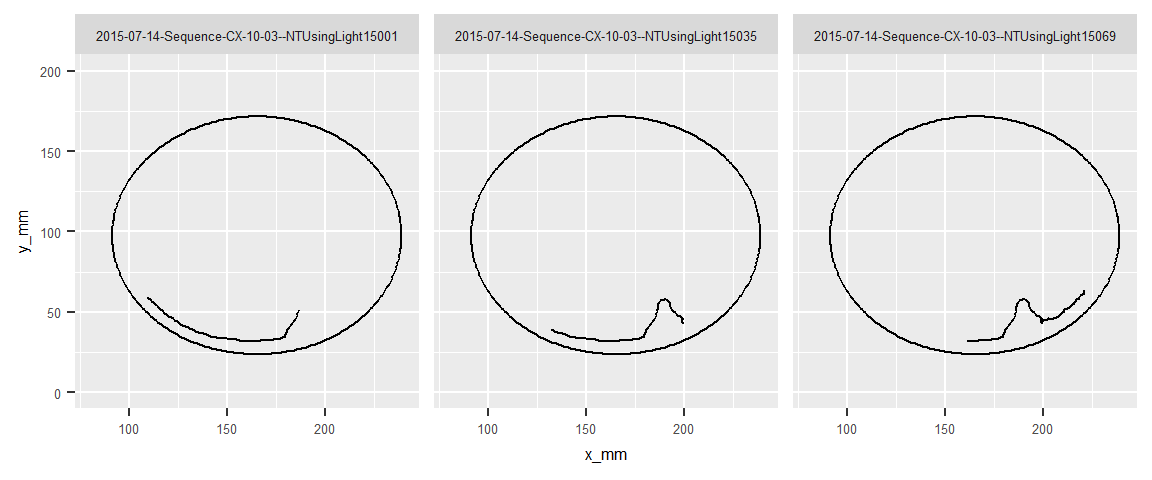 Figure 3: Three segments displayed separetely.
Majority voting
Since segments overlapped it was necessary to resolve the issue where overlapping segments belonged to different clusters. We used a majority voting approach similar to the one used in (Avgoustinos Vouros 2017), but without weights since we do not know the classes. K-means cluster analysis was performed to find the natural groupings of segments according to the above extracted features. For each point a vote was taken from each segment that overlapped that position and the point assigned to the cluster with the most votes. Points where two or more cluster groups tied, were considered unidentified.
Session information
sessionInfo()R version 3.4.3 (2017-11-30)
Platform: x86_64-w64-mingw32/x64 (64-bit)
Running under: Windows 7 x64 (build 7601) Service Pack 1
Matrix products: default
locale:
[1] LC_COLLATE=English_United States.1252
[2] LC_CTYPE=English_United States.1252
[3] LC_MONETARY=English_United States.1252
[4] LC_NUMERIC=C
[5] LC_TIME=English_United States.1252
attached base packages:
[1] stats graphics grDevices utils datasets methods base
other attached packages:
[1] bindrcpp_0.2.2 captioner_2.2.3 ggplot2_3.0.0 dplyr_0.7.6
[5] here_0.1
loaded via a namespace (and not attached):
[1] Rcpp_0.12.18 knitr_1.20 bindr_0.1.1 magrittr_1.5
[5] munsell_0.4.3 tidyselect_0.2.3 colorspace_1.3-2 R6_2.2.2
[9] rlang_0.2.0 plyr_1.8.4 stringr_1.3.1 tools_3.4.3
[13] grid_3.4.3 gtable_0.2.0 withr_2.1.0 git2r_0.21.0
[17] htmltools_0.3.6 lazyeval_0.2.1 yaml_2.1.16 rprojroot_1.3-2
[21] digest_0.6.12 assertthat_0.2.0 tibble_1.4.2 reshape2_1.4.2
[25] purrr_0.2.4 glue_1.3.0 evaluate_0.10.1 rmarkdown_1.10
[29] labeling_0.3 stringi_1.1.7 compiler_3.4.3 pillar_1.1.0
[33] scales_0.5.0 backports_1.1.1 pkgconfig_2.0.1 References
Avgoustinos Vouros, Kinga Szydlowska, Tiago V. Gehring. 2017. “A Generalised Framework for Detailed Classification of Swimming Paths Inside the Morris Water Maze.” ArXiv E-Prints, November.
Illouz, Tomer, Ravit Madar, Yoram Louzon, Kathleen J. Griffioen, and Eitan Okun. 2016. “Unraveling Cognitive Traits Using the Morris Water Maze Unbiased Strategy Classification (Must-c) Algorithm.” Brain, Behavior, and Immunity 52: 132–44. doi:https://doi.org/10.1016/j.bbi.2015.10.013.
Tiago V. Gehring, Carmen Sandi & Eleni Vasilaki, Gediminas Luksys. 2015. “Detailed Classification of Swimming Paths in the Morris Water Maze: Multiple Strategies Within One Trial.” Scientific Reports 5: 14562.
This R Markdown site was created with workflowr